
What are Organizational Charts?
An organizational chart—also known as an ‘org chart’ or an ‘organogram’—is a visual tool that illustrates an organization’s internal structure by detailing the roles, responsibilities, and relationships that exist between different individuals and teams. Organizational charts come in all shapes and sizes, and most are structured by using the “hierarchical model” where leaders and managers sit at the top and lower-level “regular” employees beneath them.
Early org charts date back all the way to the 1850s when Daniel McCallum, an American railroad engineer, illustrated a diagram of the New York and Erie Railway. And while they did gain some traction during the 20th Century, the emergence of clever, purpose-built digital org chart tools has transformed them from an invariably resented, ignored, and misused formality into what today is a valued staple of the modern organization.
Types of Organizational Chart
The type of org chart that an organization uses depends on its organizational structure and management philosophy: the chart should mirror this. While there are many different types of org chart that function in many different ways, there are three “main” ones that you should know about and will work for just about any organization.
Hierarchical Org Charts
The most common and basic type of org chart is the hierarchical one. It’s the most widely adopted organizational structure and it starts at the top with a major individual or entity, for example, a CEO or a chairperson. From this person or entity—the “root” of the chart—the structure and thus the chart cascades downwards with different departments and groups added in.
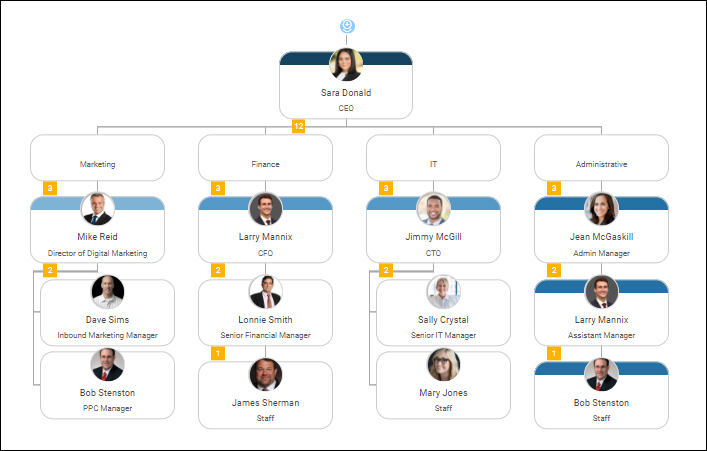
An example of a typical hierarchical org chart, built using Organimi.
Using the hierarchical top-down model, it’s possible to create reporting relationships based on parameters like employee seniority, responsibilities, location, and the projects they’re working on. In a hierarchical structure, the higher up you go the more power and authority there is.
Matrix Org Charts
One major drawback of the hierarchical model is that it limits relationships. A matrix chart overcomes this by allowing the creation of cross-functional relationships. In essence, it’s a more liberal and open form of the hierarchical chart and provides a better representation of an organization’s workflow.
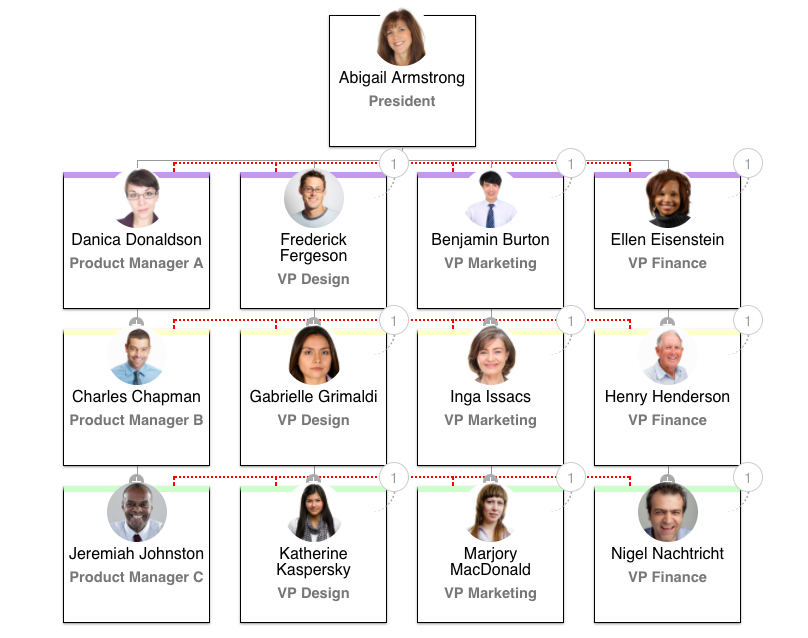
A matrix org chart built with Organimi. Note the additional lines depicting multiple reporting relationships.
The major difference between the two is that in the matrix chart, it’s possible for different groups to share functions with one another. For example, a sales team and a marketing team may cross over and share responsibilities when launching a new product or service. Matrix charts are also useful in instances where employees have more than one reporting manager.
Flat Org Charts
Flat org charts, sometimes referred to as horizontal org charts, have little-to-no levels of middle management and instead consist of two distinct levels: the people at the top (i.e., managers, administrators, and directors) and everybody else. Because of this flat structure, employees within flat organizations tend to be more self-led and have more autonomy.

Part of a flat org chart built with Organimi. Note the absence of middle managers.
Flat org charts are more commonly used by small-to-medium-sized enterprises and start-ups where there’s little need for a full-blown hierarchical model due to the smaller numbers of employees.
What is an Organizational Chart Used For?
Org charts can be used for a multitude of different things, however, they are most commonly used to provide a clear reference point of reporting relationships in an organization. New employees, for example, can use org charts to find out who reports to whom both within their department and the wider organization.
In addition to illustrating these reporting relationships, org charts can be used for things like:
- New employee onboarding,
- Project planning and management,
- Restructure planning,
- Evaluating the functions of departments and employees,
- Identifying skills gaps, and
- Informing hiring efforts.
Why Are Organizational Charts Important?
The importance of org charts in the modern workplace cannot be understated. From start-ups with anywhere between 10 and 100 employees and large corporations with thousands of staff spread throughout the world, organizational structure and org charts help decision-makers in these companies effectively manage their staff and resources.
As we touched on above, a comprehensive visual representation of an organization also has a positive impact on:
Reporting
Org charts help illustrate clear, unambiguous reporting structures for all employees within an organization. This tells employees who’s responsible for what, how work gets done, and the processes for sharing information throughout the organization. This is especially important in larger organizations where there are thousands of employees: it’s important to know who to go to with a particular issue or for certain guidance.
Restructuring
This is particularly important for start-ups and smaller organizations where growth is inevitable. As the organization goes through different growth cycles, restructuring becomes a necessity, and this can see employees shifted between teams and departments to fill in skill gaps and pass their experience on to new members of the team. With a comprehensive org chart in place, it’s much easier for managers to move employees around and toy with new organizational designs until they achieve the right balance.
Planning
The visual nature of org charts makes it much easier for long-term planning to be carried out and for contingencies and backups to be made ahead of time. This is because managers and decision-makers will be able to see potential problems before they manifest, such as skills gaps or unbalanced teams.
Limitations of Organizational Charts
Although organizational charts are extremely useful, they aren’t perfect. Like with anything, they come with their own drawbacks and limitations. Some of the main limitations of the org chart include:
Lack of Context
Although org charts do a great job of illustrating clear lines of unambiguous authority within an organization, they don’t account for different management styles and how authority is exercised internally or how work is done in practice. They also don’t always show the informal relationships that exist between employees, such as social links and committee memberships.
Rigidity
Org charts have a tendency to instill a certain sense of rigidity within organizations, especially larger ones. This is because an org chart defines clear, definite channels through which authority is exercised and information flows. This can discourage people—new employees especially—from taking harmless shortcuts which would lead to the same result while taking less time.
Frequent Updating
Org charts can quickly become out of date, especially in larger organizations that have a high amount of staff turnover. If org charts aren’t tended to as soon as a change takes place, they can quickly become more of a burden than a benefit.
This was more of a problem with “offline” org charts of yesteryear, however, even “online” org charts can suffer this problem depending on how they’ve been built. Many modern org chart tools and builders—Organimi, for example—include third-party integration support so that the update process can be automated. This ensures that your org charts are always kept up to speed with the latest internal changes.
How Do You Make an Org Chart?
Making an org chart is easy… at least, it is if you use the right tools.
While you could use a word processor to painstakingly create and put together boxes and lines to build your org chart, it makes a lot more sense to use an org chart builder like Organimi. By integrating it with your existing HR tools such as Office 365 or Microsoft Azure Active Directory, you can create a functional org chart in a matter of minutes and begin customizing it to your liking by using our intuitive building interface.
Come and see for yourself how easy it is to make functional, dynamic org charts with a 14-day free trial of Organimi.
Or, if you’d like to learn more about org charts, here are some helpful resources: