While org charts have gained significant traction in recent years, they are by no means new. In fact, the origins of the earliest org charts go back all the way to the 19th century when Daniel McCallum, a Scottish-born railroad engineer who was the general manager of the New York and Erie Railroad, designed an intricate tree to illustrate the complex nature of the railway system.
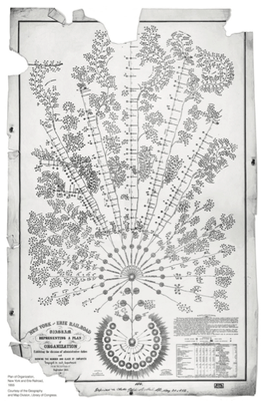
The first “official” org chart. Image credit: McKinsey.
Just as convoluted was what McCallum named the chart, a “Diagram representing a plan of organization exhibiting the division of administrative duties and showing the number and class of employees engaged in each department from the returns of September 1855.”
It’s safe to say that since its inception, the modern org chart has got a whole lot simpler despite reflecting many of the original beliefs and ideas that went into McCallum’s design: the division of responsibilities, the transparency of roles and responsibilities, and a sense of order. Indeed, it would be these ideas that would spawn a variety of different approaches to org charts and organizational design in the years to come.
A More Functional Structure
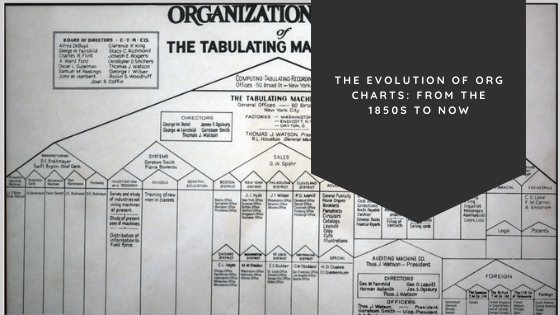
While impressive, McCallum’s structure was arguably far too fanciful for use in corporate environments of the time and in 1917, Herman Hollerith of the Tabulating Machine Company (later the Computing-Tabulating-Recording Company (CTR Co.) came up with an org chart design of their own.
Doing away with fanciful design, CTR Co. designed its own organizational structure in a highly symmetrical, pyramidal form that is similar to many of the org charts we see today. Its corporate, no-frills structure clearly illustrated the company’s functional divisions, as well as the geographical and department subcategories. And although it may not have been as design-detailed as its predecessor, it serves its purpose by clearly displaying detailed information.
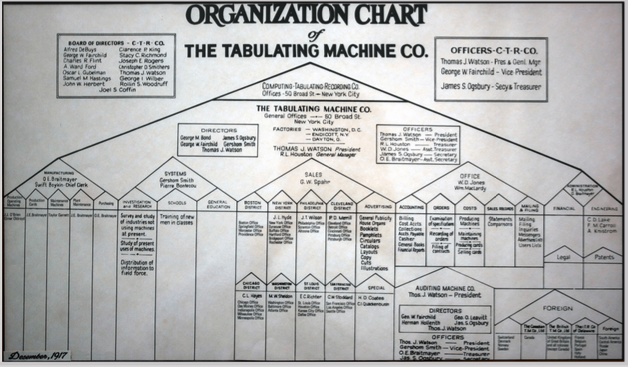
This is perhaps the first org chart that looks anything like their more modern cousins. To this day, it is still unclear as to whether Hollerith or anyone else at CTR Co. used McCallum’s work to inspire their own design. Today, CTR Co. is one of the world’s largest companies, trading under the name International Business Machines (IBM).
Breaking Down Org Charts
IBM’s re-design of the org chart started something of a trend. Until the 1950s, most U.S. companies were organized in a similar way to IBM and drafted similar org charts to illustrate their structures and reporting relationships. As time went by and with growth and innovation, organizational structures started to become more complex.
New and exciting departments in areas like advertising, public relations, and research and development led to new complexities that a functional org chart structure could no longer keep up with. And with companies beginning to structure themselves around divisions, departments, and their various product lines, something needed to change.
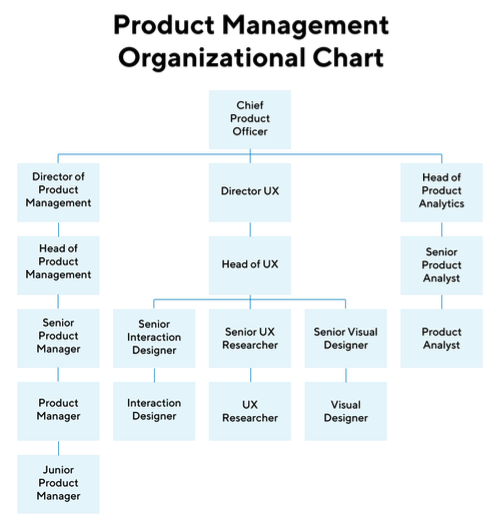
An example of an org chart for a segment of an organization, in this case, product.
Organizations started taking on product-orientated structures with the belief that they would be more efficient at operating the various departments, divisions, and product groups as separate entities, each with their own functional areas. In these structures, every person had a single job to do and they worked almost exclusively within their single team.
Changing with the Times
As time went by and business attitudes started to become less conservative, especially in the 1980s and beyond, companies began to ditch rigid, hierarchical structures and replace them with more flexible and creative structures that better reflected their core values.
For several decades now, organizations have been chopping and changing org charts so that they fit better within their own ecosystems. As a result, there are now hundreds of different org chart designs, some of which have literally turned the hierarchical structure on its head (the bottom-up structure) and have removed many layers of authority (the flat structure). Some structures are so complex, in fact, that they are very difficult to illustrate, particularly in holarchies, a method of decentralized management where all employees are considered equal and are allowed to work across various departments and projects, sharing skills and responsibilities.
Tomorrow’s Org Charts
The commercial world is highly dynamic and as we continue to fly through the modern era, it is highly likely that we will continue to see organizations change as they adapt to evolving attitudes and ways of working. In fact, the recent COVID-19 pandemic could bring about the next big change to org structures as more and more companies see the value in letting their employees work from home. In addition, as new companies are founded, they have the unique opportunity to design themselves however they please, and all it takes is for one founder with a bright idea to bring about a trend that will be mirrored by business leaders worldwide.
Although only time will tell what tomorrow’s org charts will look like, the future of them will continue to build upon new innovations and features brought about by emerging technologies. Once upon a time, org charts were designed by putting pen to paper or through add-on features in software packages designed for other purposes, such as Microsoft PowerPoint. Today, there are many cutting-edge tools and software solutions that are purpose-built for organizational design. They include all the features, tools, and functionalities that were unimaginable just a few decades ago.
As more and more companies embrace these and other technologies to diagram and illustrate their structures, we will undoubtedly see plenty of new and exciting types of org chart in the years to come. As history has shown us, however, it is nigh impossible to predict what’s around the corner!