
Using Org Charts to Track Your Project’s Budget
One of the most crucial aspects of project management is the budget. In order to ensure that a project runs smoothly and is successful, budgets need to be stuck to and monitored throughout, however, this can sometimes be easier said than done.
Even projects that have been well defined, broken down into trackable components, and have systems and processes in place to ensure they run smoothly can fail when financial problems arise.
Without something or someone in place to manage and track a project’s finances, it may be destined to fail.
Using Org Charts to Track Projects Over Time
As we have covered extensively on our blog, the many moving parts in the average project make org charts the ideal tool for keeping it on track. An org chart can be used as a standalone project management tool or slotted into your broader project management efforts.
Here are a few reasons why an organizational chart is a perfect accompaniment for any commercial project.
1. They Help Employees Understand Project Scope
Without anything in place to define them, the requirements and tasks that form part of a project can often be unknown or not wholly understood, and this can lead to confusion, ambiguity, and wasted time.
Projects that run well, to budget, and are on-task are those that make the best use of the resources that are available to them. This can only be done where the project’s scope is clearly defined and available for all to view when necessary.
A project’s organizational chart provides a complete view of project manpower, status, progress, resources, finances, and other key information.
2. They Facilitate Good Communication
Communication is key to any project. Being able to easily and successfully communicate your questions, concerns, and ideas to not only your own team, but other teams that form part of the project plays a huge role in the outcome of it. Even the most experienced and highly skilled teams can fail when it comes to comms, and this can be detrimental to success.
An org chart facilitates communication by clearly setting out who’s who in any project, what their roles are, which teams they are in, and which teams are involved and what their jobs are, among other things.
3. They Paint a Clear Picture of a Project’s Finances
The last thing any project needs is frivolous and unnecessary spending, however, this is something that happens all too often.
We get it—people get excited, perhaps overly excited, and money gets spent where it shouldn’t, or far too much gets spent on one component, leaving too little for the rest. Project bankruptcy is a real threat and it is easier to make happen than many may care to think.
Org charts can be used to not only highlight a project’s budget but other elements such as planned and real spending over time, sub-budgets for particular elements (e.g. the maximum that can be spent on outsourced graphic design), and budgets for particular teams.
This creates budget transparency and helps individuals and teams avoid spending in places they shouldn’t.
Using Organimi Org Charts for Financial Planning
Using Organimi’s powerful features, it is possible to create an org chart that not only sets out a project’s scope and who’s working on it, but also financial elements too. This is achieved through the utilization of Organimi’s custom fields that you can either create for yourself or select from a pre-defined list.
To use custom fields, open up the org chart for your project and select the ‘Custom Fields’ option in the blue top menu. This can be identified with the clipboard icon. Once you have opened up the custom fields menu, you are ready to go.
1. Add a new field
With the custom fields menu open, click on ‘Add New Field’.
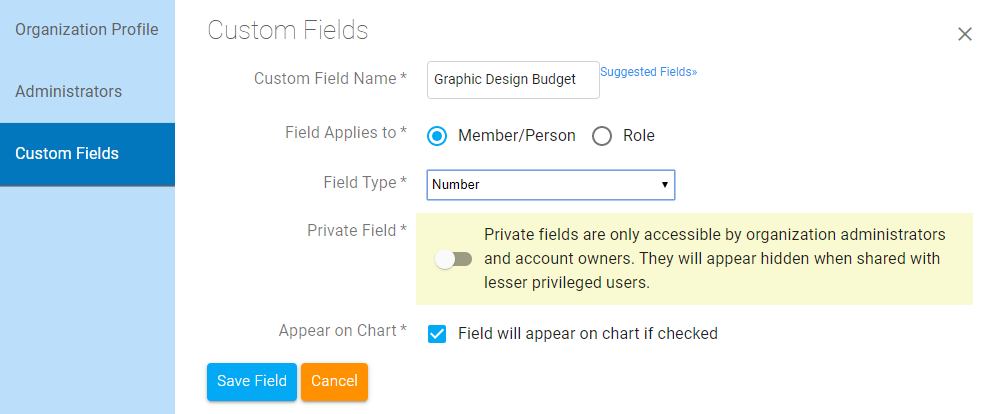
2. Define your custom field
In the menu that opens, you can define the information for your new field. In this example, we have named the field ‘Graphic Design Budget’ and selected the ‘Number’ field type. We have selected ‘Member/Person’ as this custom field will be attached to the project’s graphic design team leader.
3. Save and import your field
Click ‘Save Field‘ and you will then be able to use it in your org chart. Simply drag the field to its place on your chart and it will be there for all project members to see.
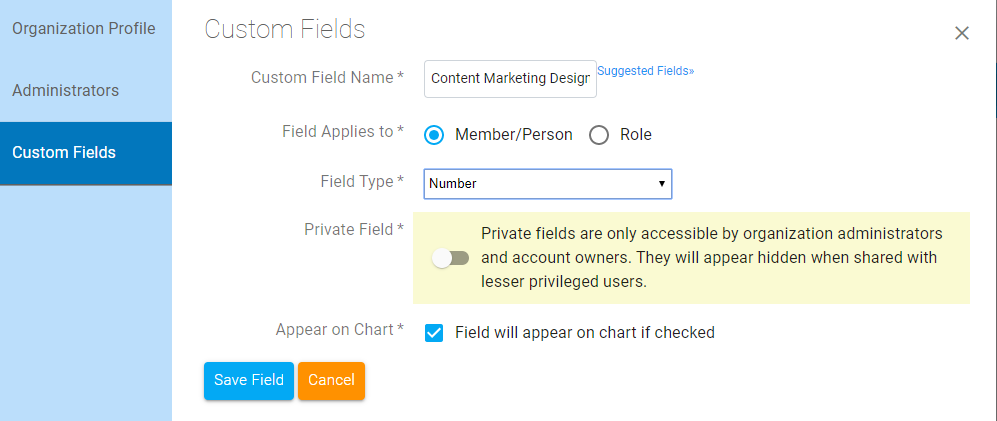
4. Creating additional fields
Depending on your project, you may want to create multiple additional fields. Here is another example we have made. In this example, the ‘Content Marketing Design Budget’ is a sub-budget of the overall graphic design budget. This is the amount of money that can be spent on creating visuals to accompany any content marketing for the project.
Make Projects More Transparent With Organimi
Organimi is the go-to for serious companies that want to create intuitive organizational charts for use in project management and a whole host of other applications.
Our cloud-based SaaS platform is easily deployable in companies big and small and can be customized to a high degree to allow for seamless use with or alongside your company’s existing tools, processes, and workflows.
Sign up for your free trial of Organimi today!