AN ORGANIMI GUIDE
How the Cloud Is Transforming the Traditional Organizational Chart Into a Strategic Business Tool.
Everything you need to know about organizational charts.
Understanding org
charts
Mapping your
organization
Planning for
change
Almost everyone who has worked for a large or medium-sized company is familiar with the ubiquitous organizational chart. First introduced in the mid-1800s, org charts evolved steadily throughout the last century.
Today, companies rely on cloud-based org charts for everything from long-term planning and new hire onboarding to driving internal communications and collaboration.
What is an organizational chart?
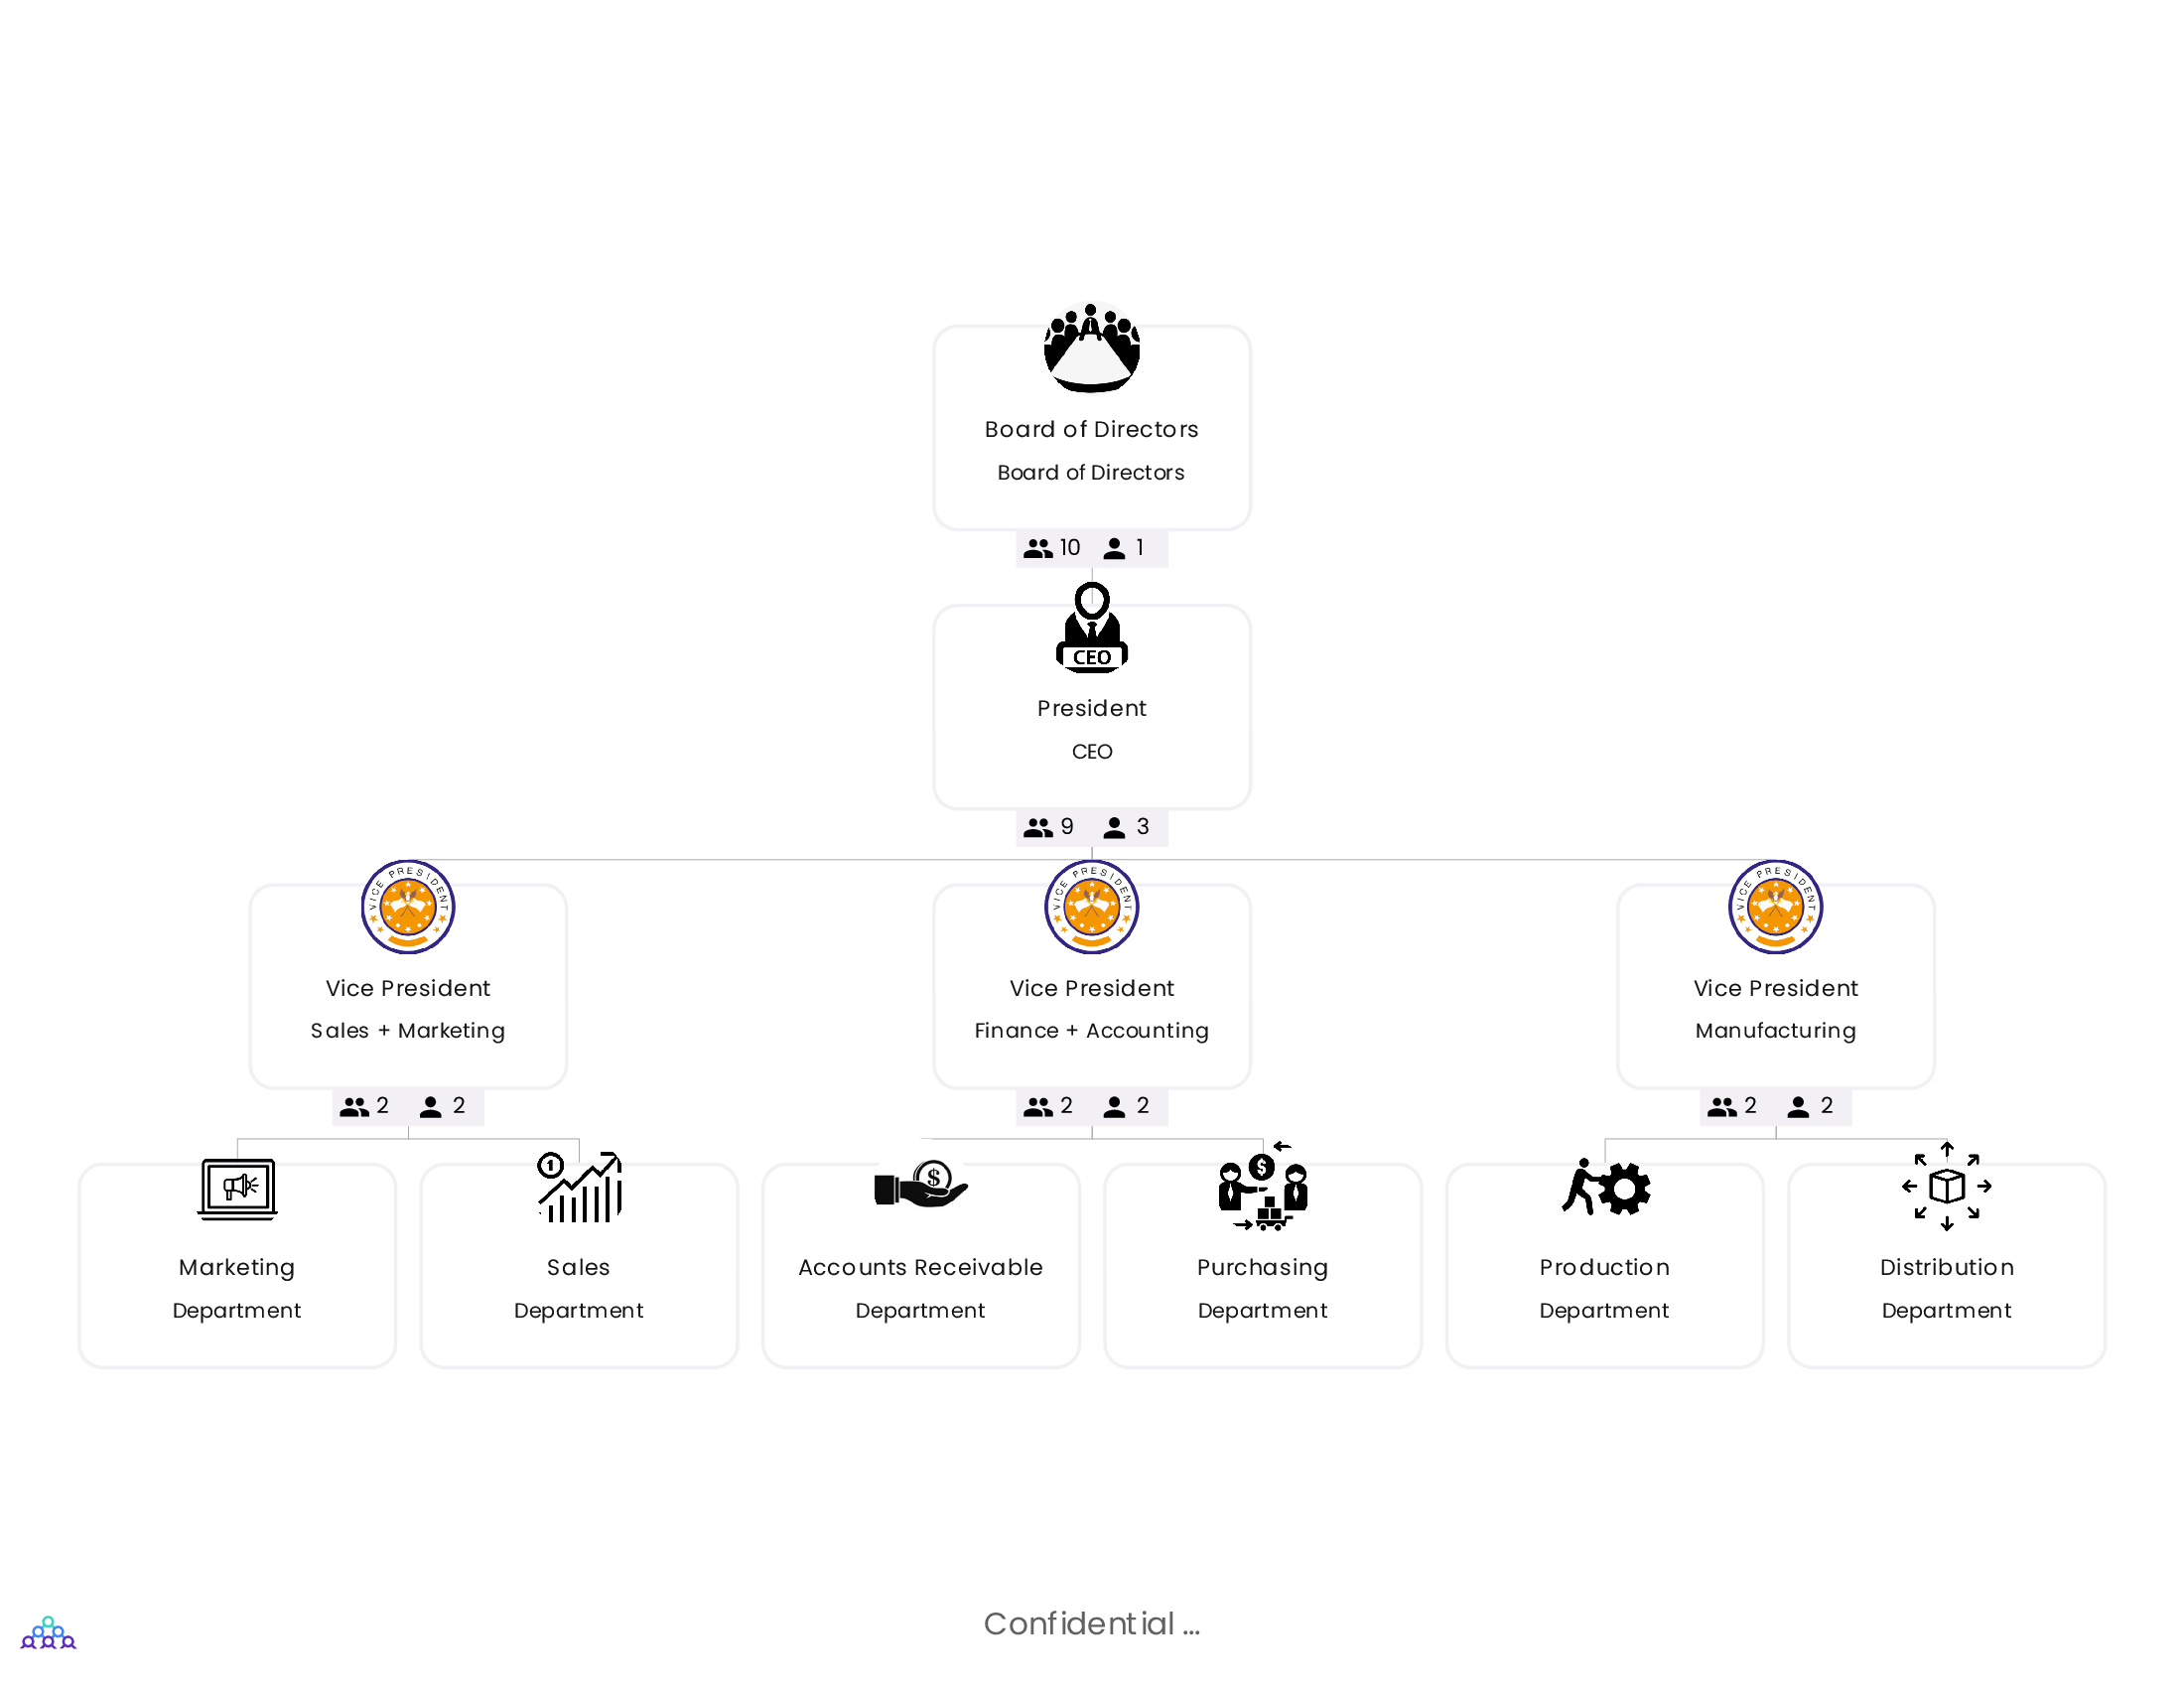
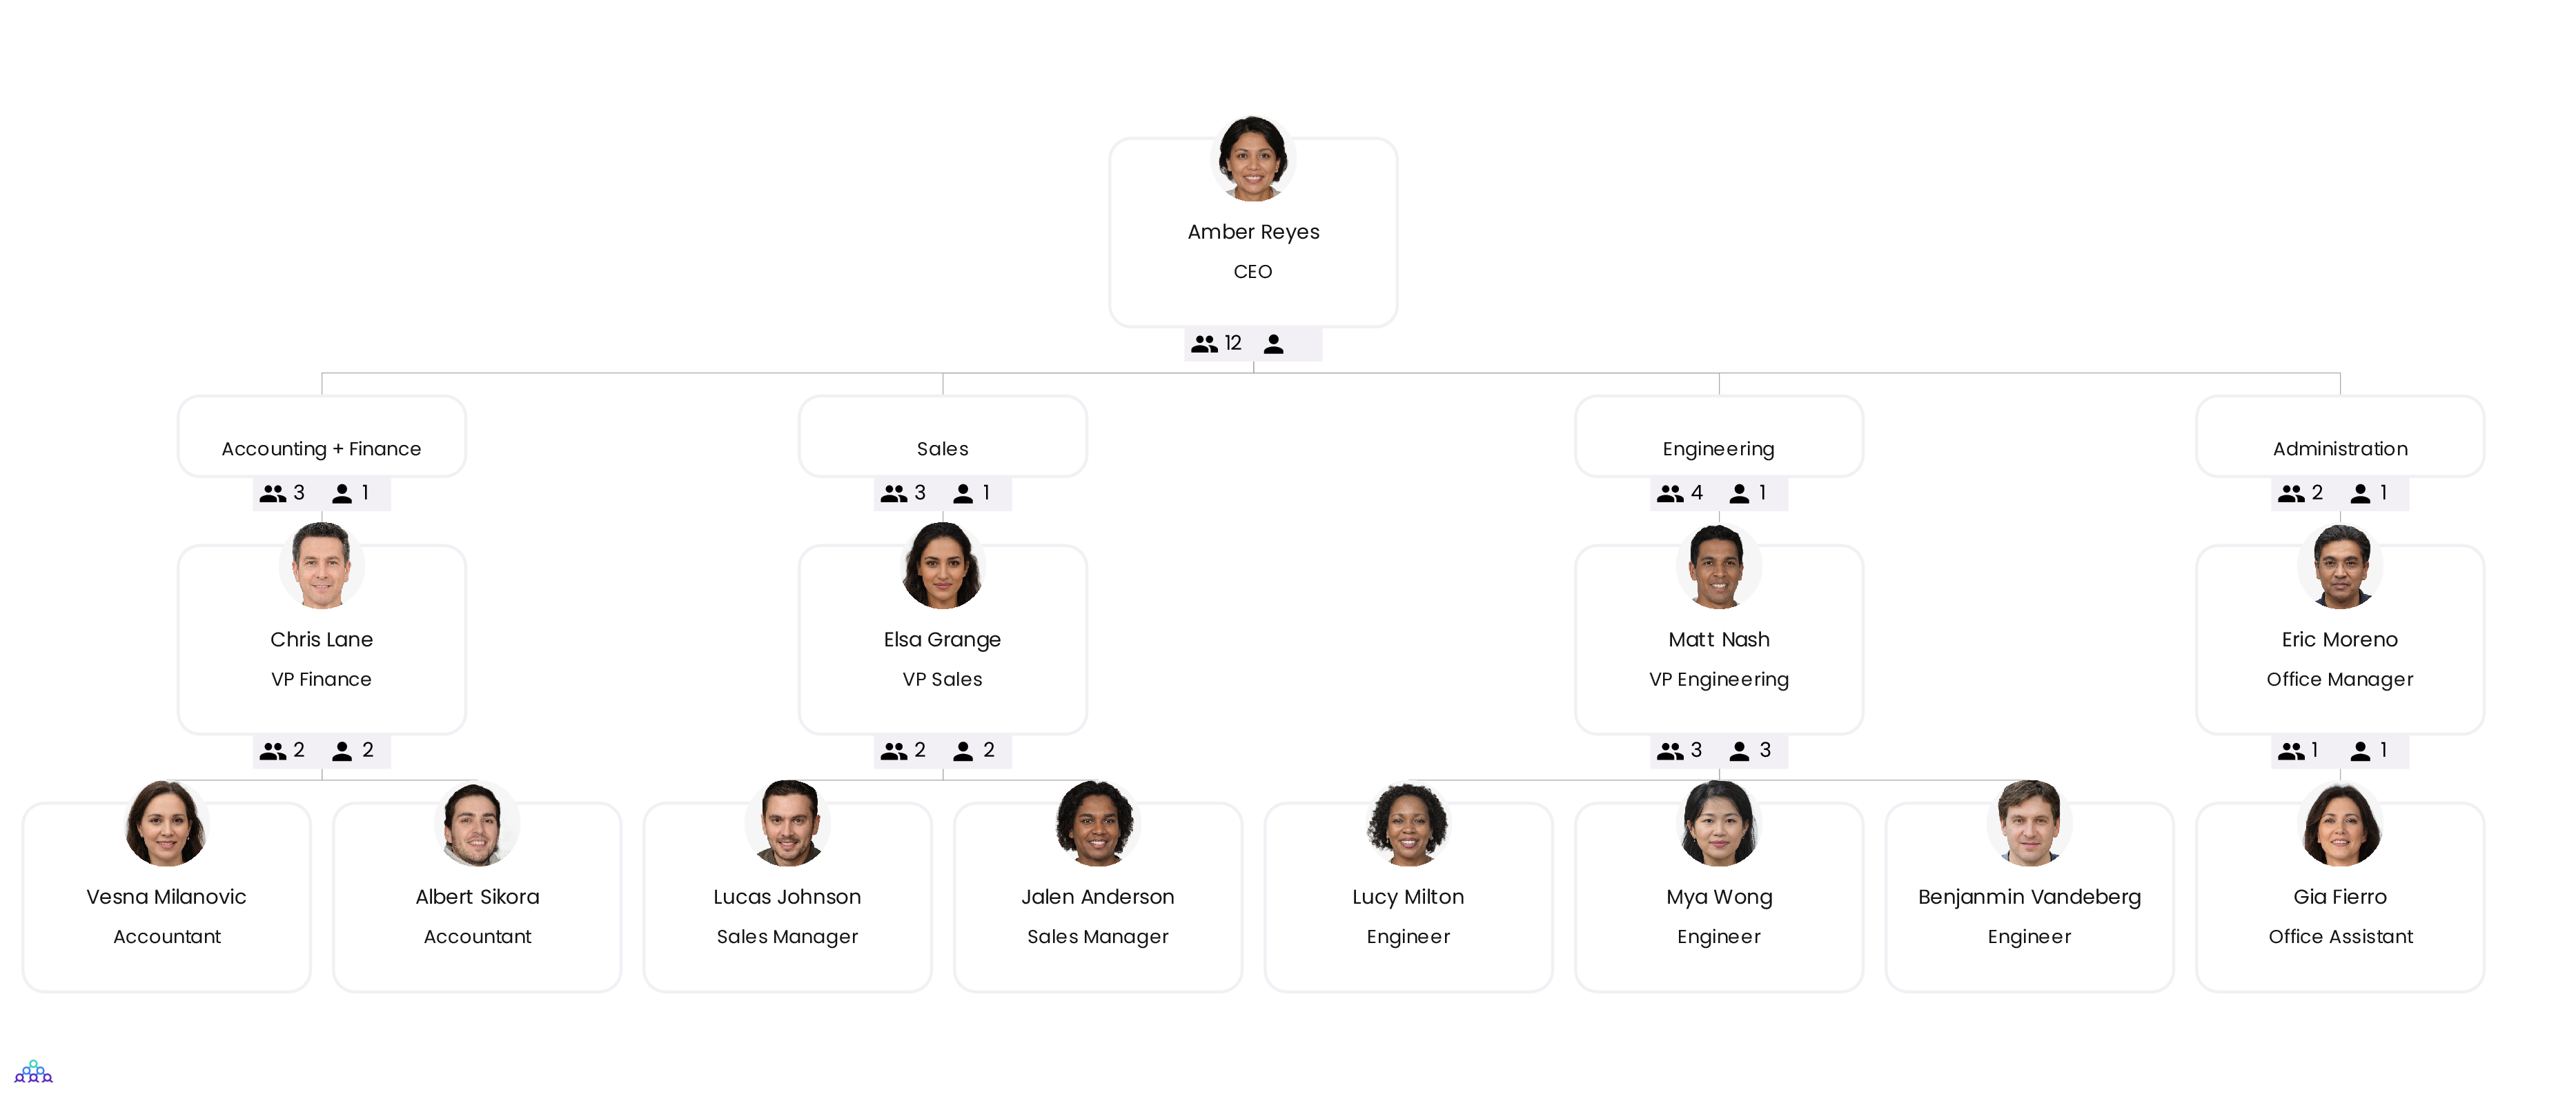
An org chart is a diagram that visually represents the structure of an organization by highlighting the roles of individuals and the relationship those individuals have with others within the organization.
Organizational charts are also known as ‘organograms.’
Perhaps the most well-known precursor of today’s org chart was developed by the Computing-Tabulating-Recording Company (CTR Co.) in 1917. CTR Co. employed a pyramid structured org chart that clearly laid out its functional divisions, departments, and geographic subcategories. In 1924, CTR Co. was renamed International Business Machines (IBM).
Learn more about the evolution of organizational charts here.
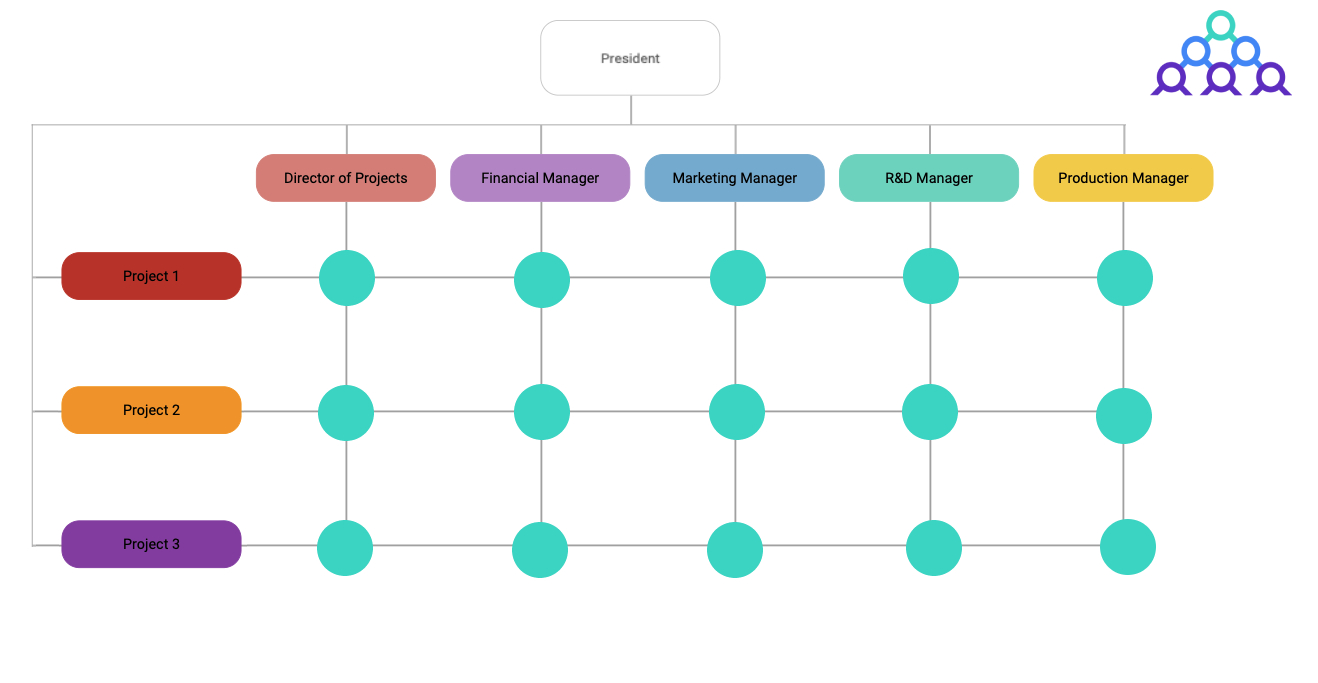
Hierarchical Versus Matrix-based Organizational Structures
While there are many different organizational structures, the two most well-known and widely used organizational charts are hierarchical and matrix-based.
Hierarchical is the more common of the two. It is represented by a pyramid-shaped org chart with senior leadership (e.g., the CEO) at the top, working its way down through each reporting relationship to the individual contributor level at the bottom.
Pros. The hierarchical structure clearly defines levels of authority and reporting relationships. It establishes clear paths for accountability and communication that can help promote team identity within departments.
Cons. A rigid hierarchical structure can create silos and discourage collaboration across functions and departments. It can lead to territorial behavior and create unneeded bureaucracy, especially in larger organizations.
A matrix organization occurs when teams or individual employees have multiple managers. The matrix structure is commonly used in organizations where employees are divided into teams and operate using cross-functional groups rather than a linear reporting structure. The matrix org chart resembles a grid, reflecting the cross-functional nature of the organization.
Pros. A matrix structure enables the sharing of skilled resources between different departments and teams. It simplifies cross-departmental communications and knowledge-sharing and creates a more dynamic working environment.
Cons. The multiple reporting relationships inherent to the matrix structure can create priority conflicts and uncertainty about responsibilities. The dynamic nature of matrix organizations can lead to discomfort for some employees and negatively impact performance coaching and career development.
ORG CHART GUIDE
QUICK LINKS
AN ORGANIMI GUIDE
5 Benefits of using organizational charts.
Customizable
views
Speed up your
onboarding
Workforce
planning
Today’s org charts can link to multiple data sources and provide customizable views, offering many benefits to employees and other stakeholders:
Improve collaboration and communication:
Employees and teams looking to work cross-functionally use org charts to identify and engage potential collaborators across the enterprise.
Improve collaboration and communication:
Employees and teams looking to work cross-functionally use org charts to identify and engage potential collaborators across the enterprise.
Enable workforce planning:
Org charts are invaluable tools for restructuring and planning for future growth. They can provide a snapshot of an organizations current state and be used to explore multiple ‘what-if’ scenarios.
Support new hire onboarding:
According to Glassdoor, great employee onboarding can improve employee retention by 82%, but Gallup found that 88% of employees think that their employer doesn’t onboard well.
Org charts are a valuable tool to onboard new hires. They provide a single-page snapshot of the entire organization and help onboarding employees to identify leaders and understand reporting relationships and team structures. Depending on how much information the org chart includes, new hires can also gather a more detailed view of their team members’ skills and responsibilities.
Give employees more information.
Today’s org charts can provide much more information than reporting relationships and contact details. They can include advanced, searchable directories, identify project teams and ‘dotted line’ reports, and sync with email and calendar apps.
Online Organizational Charts Versus Using a Software Application
Many organizations still use traditional office software applications (e.g., Powerpoint or Excel) to create their org charts. However, these charts have many disadvantages compared to those built with dedicated, cloud-based tools:
- Difficult to create and update: Creating and updating charts with office software is tedious and time-consuming. Purpose-built cloud solutions can dramatically reduce administration time, allowing HR teams to prioritize more important tasks.
- Static, outdated information: Org charts created in tools like Powerpoint are ‘point in time’ organizational pictures that quickly become outdated. This often results in the sharing of multiple versions of obsolete org charts across the enterprise. Cloud-based charts allow for real-time updates that are readily available to every employee.
- Cannot link to other applications: Traditional office applications typically cannot import information from other sources like HR applications. This limitation can result in time-consuming data reentry and restrict what information can be incorporated. Cloud-based org chart solutions easily import data from HR and CRM solutions like Salesforce, providing stakeholders with a wealth of supplemental data.
ORG CHART GUIDE
QUICK LINKS
AN ORGANIMI GUIDE
Strategic Uses for Organizational Charts.
What to
include
Budgeting and
planning
Regulatory and
compliance
What To Include In Your Organizational Charts
Almost every org chart includes essential information like reporting structures, employee names, and contact data. However, depending on the purpose, specific charts can incorporate much more valuable information, including:
– Vacant, approved positions
– Employees on maternity or disability leave
– Total headcount and full-time equivalent (FTE) numbers
– A breakdown of full-time, part-time, and contractors
– Employee photos
– Links to employee profiles, projects, and certifications
Organizational Charts Versus Photoboards and Directories
While related, org charts, directories, and photoboards all perform different functions. Org charts highlight organizational structures and reporting relationships, while a directory’s primary purpose is to provide employee contact information. Photoboards may include some contact information, but their main function is ‘putting a face to a name’ to facilitate internal communications.
With cloud-based solutions, users can incorporate all these elements into a single database, providing a more comprehensive, customized view to all stakeholders.
Strategic Uses for Organizational Charts
Many people consider the org chart as merely a tool to identify individuals and reporting structures. However, today’s organizations look much different than their legacy counterparts. They’re often virtual and highly fluid, with teams forming and reforming to meet ever-changing priorities. Traditional, paper-based org charts can’t meet the requirements of these organizations.
Luckily, dedicated, cloud-based org chart tools that effectively share data and integrate with other CRM apps have transformed the org chart’s utility. Here are some of the more strategic ways organizations are leveraging today’s enhanced org charts:
Budgeting and Planning
Org charts can provide a comprehensive snapshot of many data points that are critical to the planning process, including:
– Reporting relationships
– Span of control
– Open headcount and resource gaps
– Cross-functional teams
Org charts also serve as ‘what-if’ tools to develop and communicate potential organizational changes, align to new priorities, build budgets, and identify valuable resources.
Regulatory and Compliance
Companies like banks, auditors, or legal firms may need to provide org charts to shareholders or governing bodies. These charts identify clear chains of command and support proper governance and transparency.
ORG CHART GUIDE
QUICK LINKS
Compelling External Organizational Chart Use Cases
While org charts have many practical uses within an organization, the benefits don’t stop there. Today, many companies are improving performance by using org charts to align with partners and customers. Here are some examples:
Partnering With Other Organizations
Most successful companies need to partner with other enterprises to optimize the supply chain, support a distributor relationship, or manage joint go-to-market projects. Org charts are an efficient way to build alignment between organizations by sharing contact information, roles, responsibilities, and reporting structures.
Aligning with Customers
On a similar note, many companies provide their customers with charts detailing specific parts of their organization. For example, a computer hardware vendor may supply a detailed org chart of its service organization that includes an executive escalation path. This information helps customers engage vendors more efficiently and promotes customer satisfaction.
Leveraging Organizational Charts as Sales Tools
For salespeople, developing specialized customer org charts is critical to the sales process. While standard org chart information like contact data and reporting structures is valuable, it’s only the baseline. Smart sales teams leverage customer org charts for many other purposes, including:
– Identifying influencers, budget-holders, and decision-makers
– Targeting and tracking sales initiatives like presentations or call campaigns
– Presenting customer information in internal quarterly business reviews
– Aligning technical and operational resources to customer requirements
– Finding avenues for up-selling and cross-selling opportunities
– Assessing sales rep activities, performance, and effectiveness
AN ORGANIMI GUIDE
How to Create an Organizational Chart.
Common
uses
Building with
Organimi
Transform your
organization
It’s very common for smaller organizations and non-profits to use tools like Microsoft Word, Powerpoint, or Adobe to create their org charts. These applications offer several advantages:
– Users are already familiar with how to use them
– There are no incremental costs
– Completed org charts provide basic functionality
Microsoft Visio is another program often employed to create org charts. Powerpoint users will quickly grasp the basics of Visio, but Visio is a much more powerful and flexible tool.
Visio does, however, share many of the limitations that traditional desktop applications have for creating and maintaining org charts, including:
– Slow and difficult to use
– Limited sharing functionality
– Inflexible and can’t scale
– Minimal data import capabilities
– No integration with CRM and external applications
The Evolution of Organizational Chart Creation — It’s in the Cloud
Dedicated, cloud-based org chart solutions offer much greater utility and eliminate many of the challenges of using traditional office software. Leading providers like Organimi, Pingboard, Lucidchart, and ChartHop deliver many benefits, including:
Save time and administrative effort.
These solutions are simple to learn and save considerable administrative efforts, freeing up staff for more high-impact activities.
Provide powerful importing and integration capabilities.
HR teams can import data in standard formats like Excel and CSV, perform bulk photo imports, and even include external sources like LinkedIn. These solutions support integration with many common CRM applications and platforms like Salesforce and Google’s G Suite.
Highly customizable
Custom fields and multiple color-coding options provide a more effective, immersive presentation of organization data.
Easy to update and share
Many cloud-based org chart solutions can automate elements of the updating process. Updated charts are simple to share, typically by embedding a widely-accessible link on an internal site.
Is a Cloud-Based Organizational Chart Solution For You?
It’s a question of when, not if, most organizations should adopt a dedicated, cloud-based org chart solution. With no capital investment required, cloud-based solutions are cost-effective to implement and easy to scale. By reducing administrative costs and offering greater utility for all stakeholders, cloud-based org charts can deliver a compelling return on investment for organizations of every size.
ORG CHART GUIDE
QUICK LINKS
Building Organizational Charts with Organimi — Getting Started
Although Organimi is one of the most powerful and flexible cloud-based org chart solutions, it’s also simple to learn and use.
Creating an Org chart with Organimi begins with a straightforward, three-step process:
1. Create an organization.
From your Organimi dashboard, click the ‘+ New Organization’ button. Once the ‘Create a New Organization’ pop-up window appears, enter the New Organization name. Finally, click ‘Create.’ Watch a quick explanatory video here:
2. Add members to your organization roster.
Organimi provides two ways to add members to your chart — manually adding roster members one at a time or importing a list of names from an Excel spreadsheet or CSV file to the roster. To manually add a new member, click ‘Roster,’ then ‘New Member.’ Complete the New Member screen that appears, then press ‘Save.’ You can save time by creating your org chart using files containing existing names, titles, reporting information, etc. From your dashboard, click the ‘Bulk Import’ button. When the ‘Import Members and Roles’ screen appears, follow the steps to import, review, and finalize members and roles for your org chart. Here’s a short video to walk you through the process.
3. Build out the organizational chart.
This is also a three-step process that involves selecting your chart type (traditional or matrix), adding roles to your chart, and adding colleagues and subordinates. Find detailed instructions and a video for each step here.
Can Organimi Transform Your Organization?
From Starbucks to Uber and Shopify, companies worldwide are using Organimi to create comprehensive org charts used to help transform business planning, internal communications, and employee effectiveness.
Organimi org charts are simple to create and use yet scale to meet even the largest organizations’ needs. Cloud-based Organimi ensures org charts can be quickly updated and easily shared with all internal and external stakeholders, no matter where they’re located.
Using Organimi can dramatically reduce the time and effort needed to create and update org charts, freeing up your HR and admin teams to pursue other, more strategic activities. And Organimi’s flexible import/export capabilities allow you to integrate with many of the most common CRM and HR applications.
If your organization is still using traditional office tools to create and manage your org charts, it’s time to consider Organimi.
To learn more about how other organizations are using Organimi,
Let’s get you started!
Organimi is a powerful, cloud-based org chart management platform that helps you connect and collaborate with your colleagues wherever they work!