
Organizational charts (or “org charts”) are helpful visual tools that outline the structure and hierarchy of an organization. These charts map out the relationships between various roles, departments, and personnel, illustrating the reporting lines and levels of authority within an organization.
If your company doesn’t have one yet, we’ll show you how to build an org chart in PowerPoint, one of the most accessible tools for the job. We’ll also teach you how to make a powerful cloud-based org chart using Organimi’s org chart builder.
How to Build an Org Chart in Microsoft PowerPoint
Microsoft PowerPoint is more than just a presentation tool. It’s an incredibly flexible piece of software that can be used for a variety of purposes, including diagramming, and building org charts.
Here’s how you can build your own organizational chart in PowerPoint in as little as five minutes.
1. Insert SmartArt
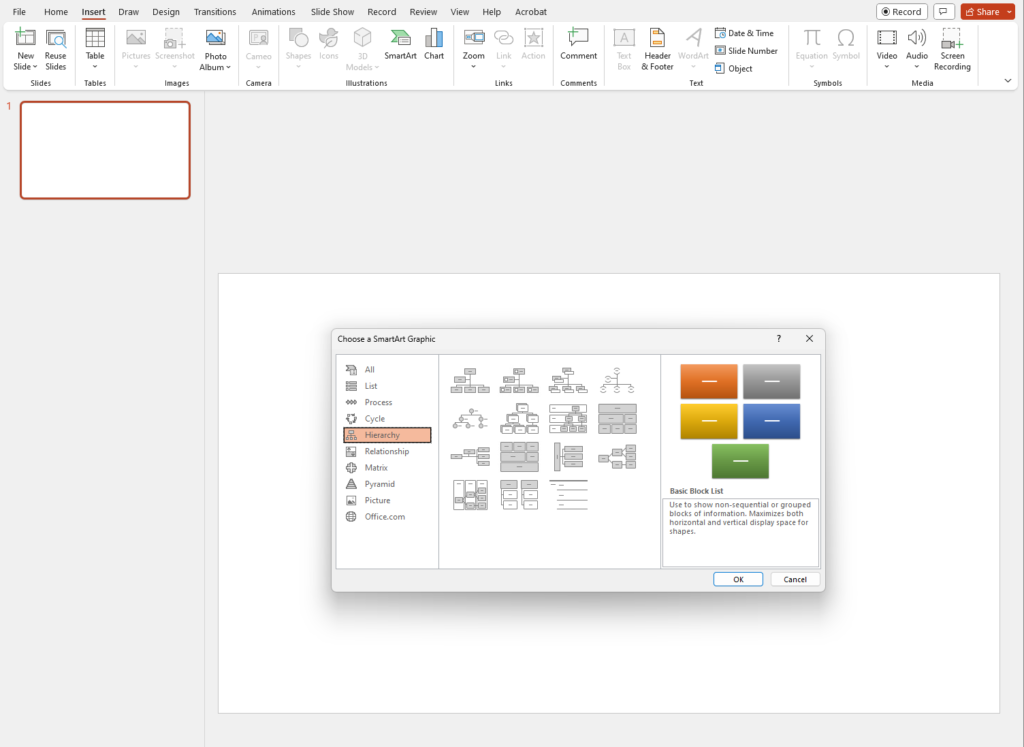
Building an org chart in PowerPoint makes use of SmartArt functionality. In your document go to the Insert tab and click SmartArt to begin. A window will pop up prompting you to choose a SmartArt graphic. Navigate to the Hierarchy option and select an org chart template from the options.
2. Enter Your Text
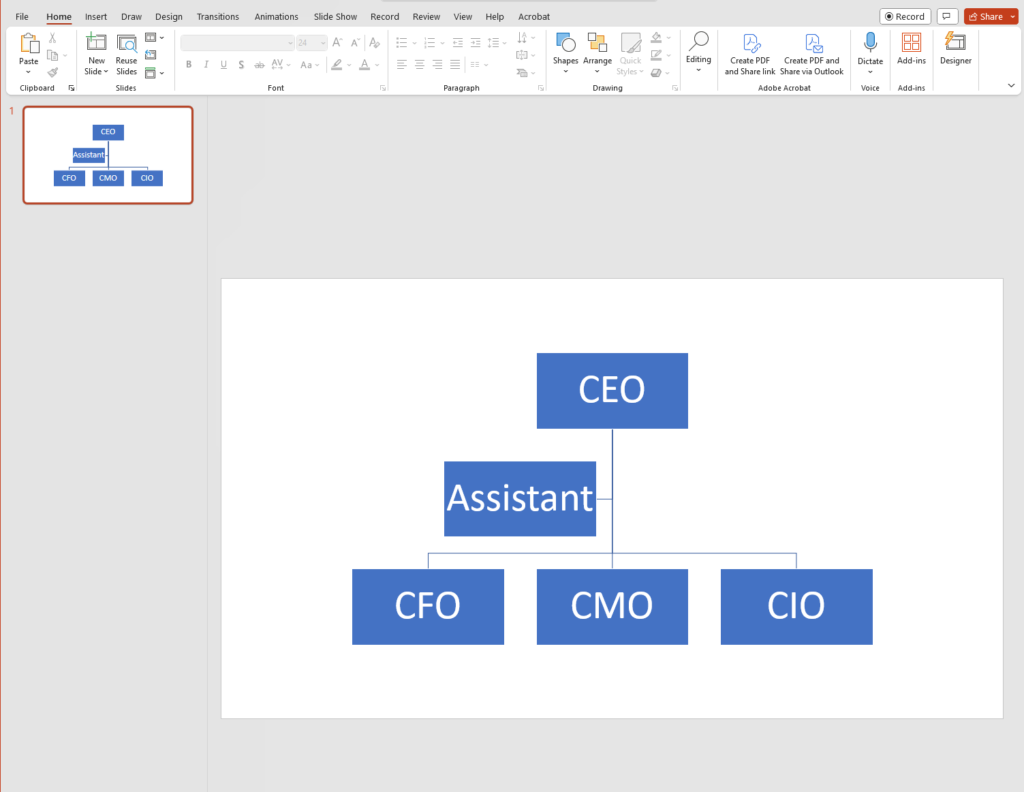
You can now click into the shapes and add text. Each one of these individual shapes in the chart represents an individual within the organization, and you’ll need to manually fill them out accordingly.
3. Add Shapes
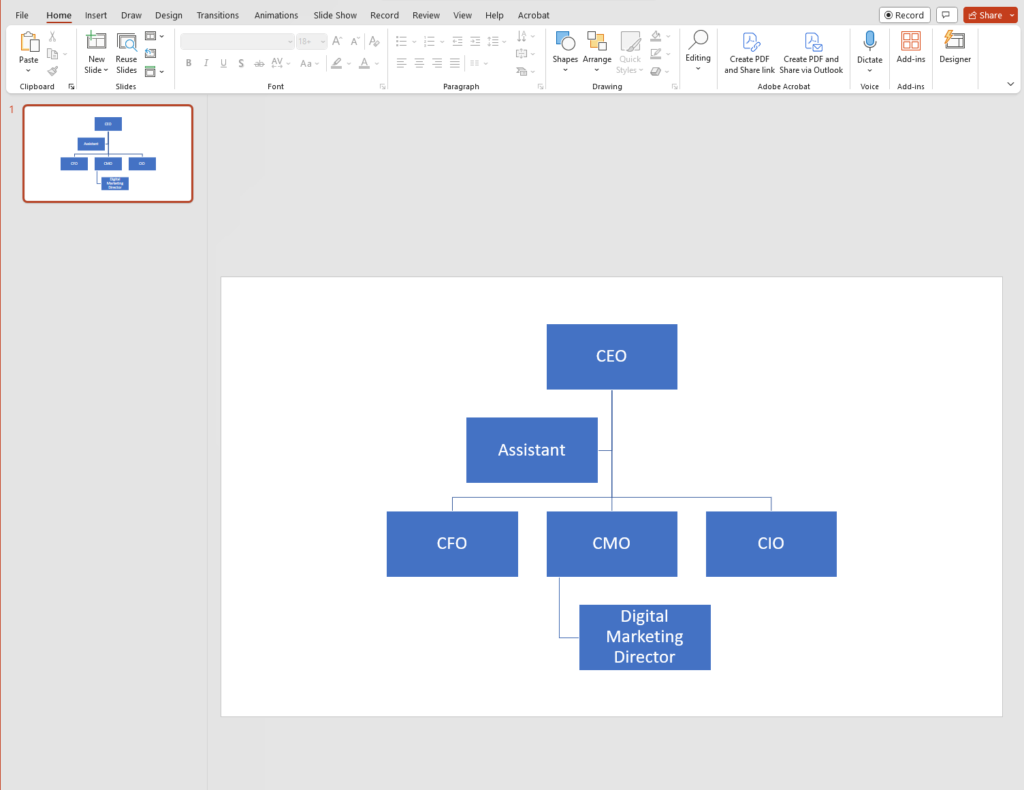
You’ll probably need more shapes than the default template includes. To do this, click into the SmartArt Design tab and then select Add Shape from the top-left side of the options ribbon. You can select where this new shape goes by clicking on an existing shape in the org chart.
For instance, if you wanted to add a subordinate to the CMO, you would select the CMO shape before clicking Add Shape.
4. Flesh Out Your Hierarchy
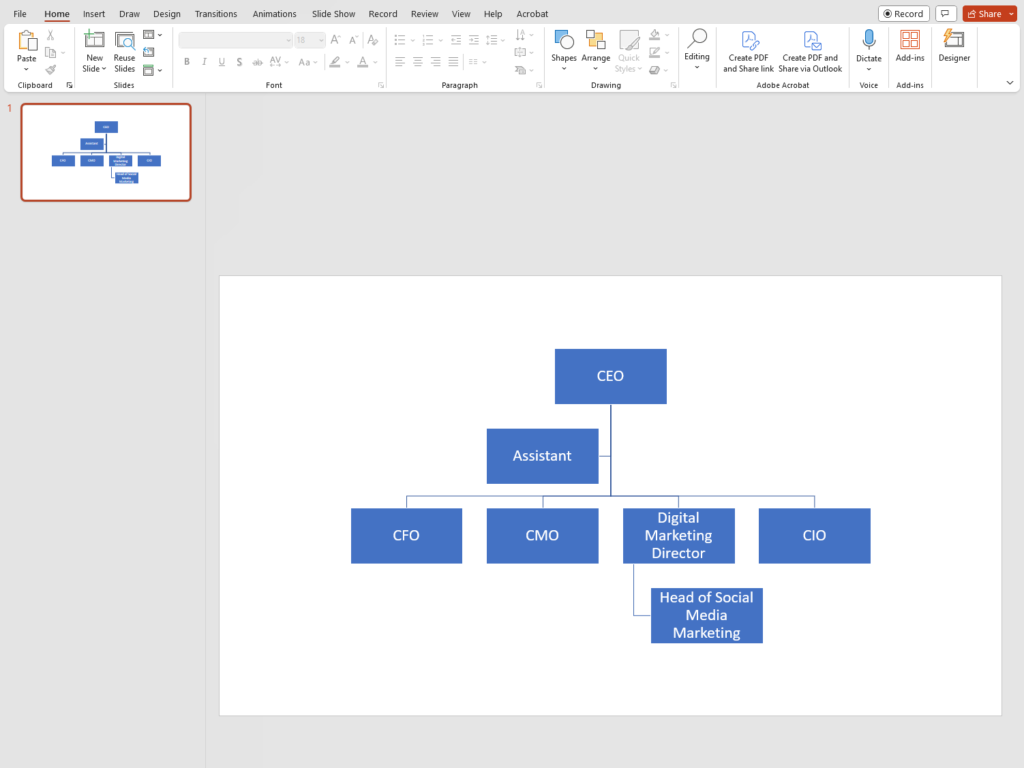
When you’ve got all your individuals and roles added, you can rearrange the hierarchy by clicking on the individual that you wish to move and use the Promote, Demote, Move Up, or Move Down options from the SmartArt Design menu.
As you can see, promoting the ‘Digital Marketing Director’ moves that individual one level up the chain of command.
5. Format Your Design
When you’re happy with the overall layout of your org chart, you can then use the various design options to customize its look and feel of it by modifying colors, fonts, layout styles, and more.
PowerPoint Org Chart Limitations
Although building org charts is quick and easy in PowerPoint, it does have limitations when it comes to diagramming more complex charts.
PowerPoint’s built-in org chart templates might not accommodate complex organizational structures or non-traditional hierarchies. This means that creating custom designs can be cumbersome and time-consuming, if not impossible.
These limitations also stretch to collaboration. Multiple users working on the same file simultaneously can lead to version control issues or conflicting changes. PowerPoint org charts are also static. They lack the interactivity and dynamic features required for real-time updates or drill-down capabilities that could showcase detailed information about specific departments or roles.
As organizations grow or change, updating org charts in PowerPoint becomes unwieldy. Keeping them current with staffing changes or structural modifications can be labour-intensive.
Is There an Org Chart Template in PowerPoint?
Yes, PowerPoint has pre-made org chart templates you can use and edit as you see fit.
Here’s how to access them:
- Open PowerPoint and on the Home screen, select “New” to create a new presentation.
- Go to the search bar on the top right. Type “Organizational Chart” and press Enter. You’ll see a variety of templates you can use.
- Select your preferred template and then press the “Create” button on the bottom right corner to open a new presentation with the org chart layout.
How Should You Lay Out an Org Chart in PowerPoint?
Follow these tips when making your org chart for clarity and effectiveness:
- Start from the top: Start from the highest authority (e.g., CEO) at the top of the chart and work your way down.
- Use consistent shapes: Designate specific shapes to represent different roles for clarity (e.g., rectangles for employees, ovals for consultants).
- Utilize color coding: Use color coding to differentiate between departments or levels of management.
- Keep it straight: Only use straight lines to connect the boxes. Avoid curved or crossing lines.
Using Organimi to Build Powerful Org Charts
If you’ve tried to build your org chart in PowerPoint and you’re finding that the above limitations resonate with you, then we recommend using Organimi.
Organimi was designed specifically for creating powerful organizational charts, so you won’t run into any of the frustrating limitations that exist in PowerPoint. Using a wide range of tools and integrations, you can build large, complex organizational charts in a matter of minutes.
Getting Started with Organimi
Sign up for a free Organimi account and then open up a new Organimi workspace to begin diagramming. Our intuitive interface and a wide variety of features make it easy to get started without being bogged down by a huge learning curve.
Drag-and-Drop Building: Organimi has been designed specifically for building org charts, meaning you can build a chart that would take hours in PowerPoint in a matter of minutes using our native design features.
Endless Integrations: Organimi Connect comes with pre-built connectors for Microsoft, Google, Salesforce, and more. Keep your chart up to date in real-time, all the time, with comprehensive integration solutions, or connect it with your existing HR solution.
SmartChart™ Legend: Use Organimi’s unique SmartChart™ Legend feature to help visualize information on your chart and attach conditions to custom fields. Make your chart even more visually appealing with Organimi’s flexible formatting and branding options.
Presentation-Ready Charts: If using PowerPoint is a must for you, no problem! Organimi charts can easily be inserted into presentations by exporting them as PDF, PNG, or PPTX files. Let Organimi do the work for you by automatically splitting your chart across different pages and slides.