

A modern organization runs on data. From tracking performance to guiding strategy, data and analytics teams play a critical role in helping businesses make informed decisions. As these teams grow, a clear structure becomes essential to keep work aligned, data trusted, and insights delivered on time.
A well-defined data and analytics team organizational structure helps organizations clarify ownership, improve collaboration, and ensure accountability across data engineering, analytics, and governance. An organizational chart makes this structure easy to understand and easier to manage as teams scale.
What Is a Data and Analytics Team Organizational Structure?
A data and analytics team’s organizational structure is a visual framework that shows how data-related roles and departments are organized within the team. It outlines reporting relationships, core responsibilities, and how teams work together to collect, manage, and activate data.
This structure helps organizations turn raw data into actionable insights while maintaining data quality, security, and consistency. It also gives stakeholders a clear view of who to work with and how data decisions are made.
The Main Components of a Data and Analytics Organizational Chart
While team structures vary by company size and maturity, most data and analytics teams include the following key roles and departments.
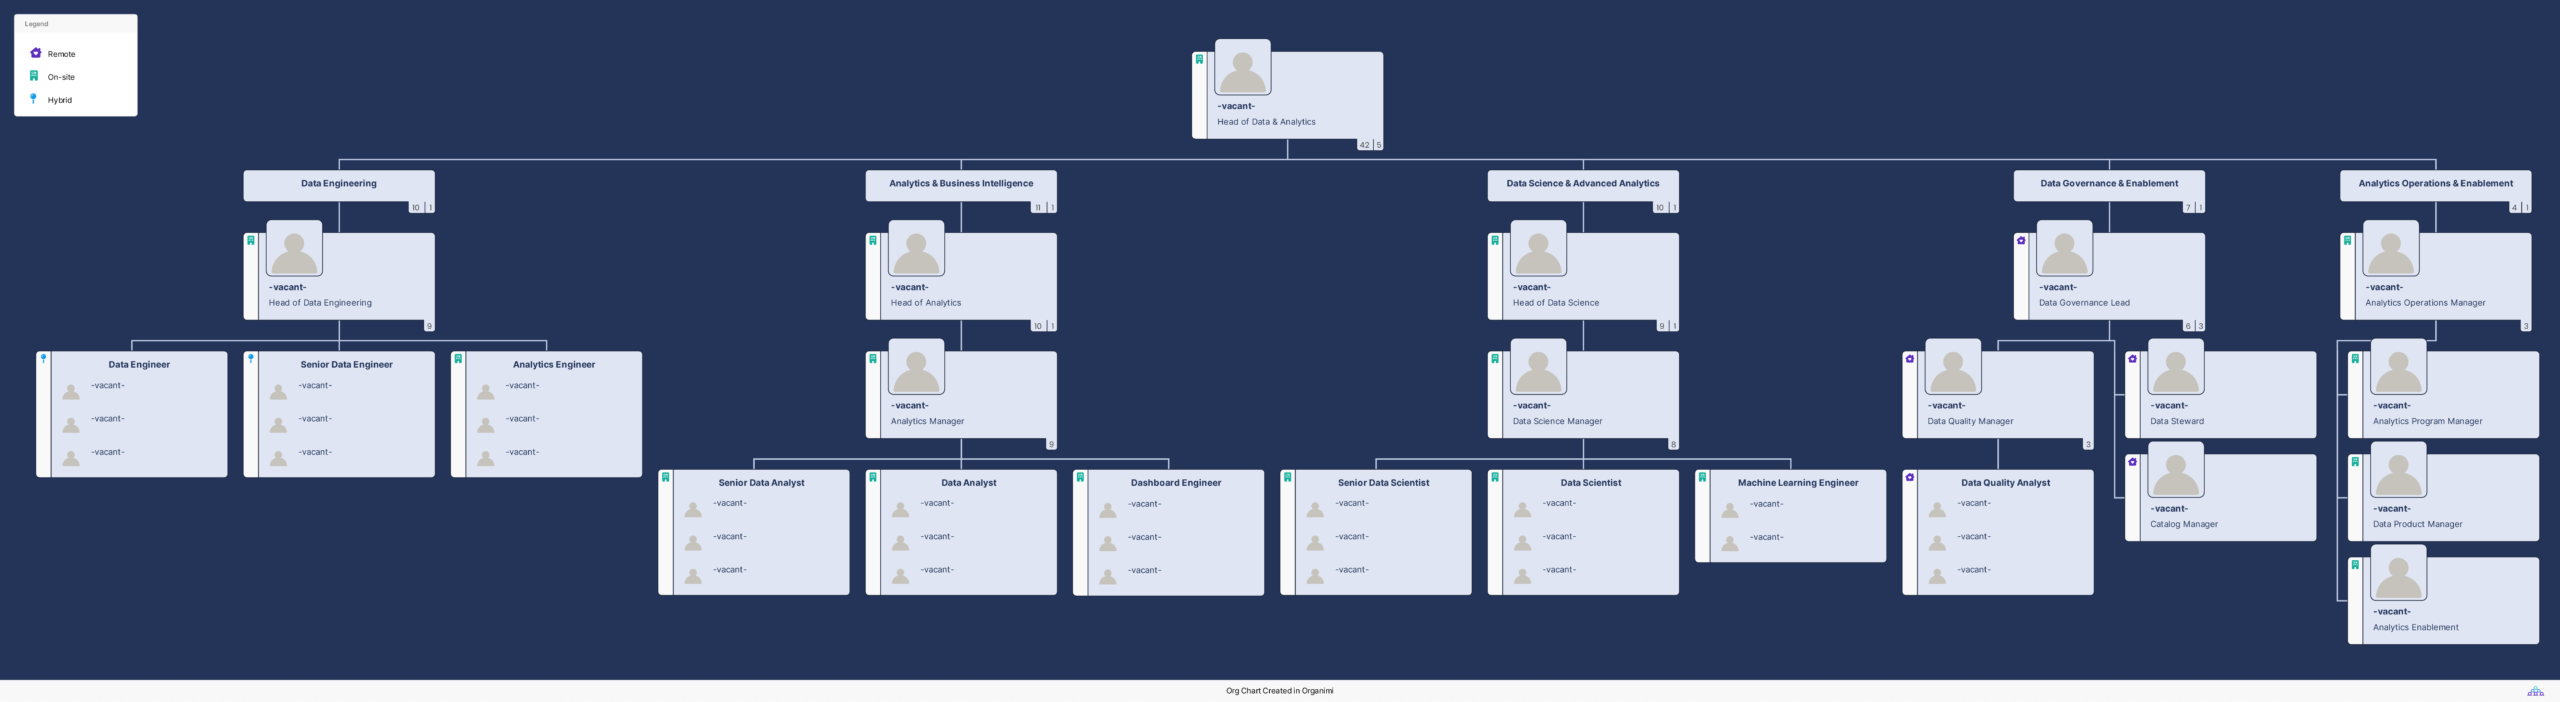
Head of Data and Analytics — Is responsible for the overall data strategy. This role aligns data initiatives with business goals, sets priorities, and oversees all data-related teams. Titles may include Chief Data Officer, VP of Data, or Director of Data.
Head of Data Engineering — Leads the data engineering function and reports to the Head of Data and Analytics.
Data Engineers and Analytics Engineers — Design data pipelines, manage warehouses, and ensures reliable, accessible data.
Head of Analytics or Analytics Manager — Oversees analytics delivery and stakeholder engagement and reports to the Head of Data and Analytics.
Head of Data Science — Leads experimentation, forecasting, and machine learning initiatives and reports to the Head of Data and Analytics.
Data Scientists and Machine Learning Engineers — Build models that support personalization, optimization, and long-term strategy.
Data Governance Lead — Defines standards for data quality, access, and compliance and reports to the Head of Data and Analytics.
Data Stewards and Data Quality Analysts — Maintain documentation, monitor quality, and support data adoption across teams.
Common Data and Analytics Organizational Structures
Organizations structure data teams in different ways depending on size, goals, and data maturity.
Hierarchical Structure — This structure uses clear reporting lines from the Head of Data and Analytics down to managers and individual contributors. It works well for larger organizations that need strong governance and consistency
Functional Structure — Teams are grouped by discipline such as data engineering, analytics, and data science. This approach supports specialization and clear ownership within each function.
Matrix Structure — In a matrix setup, data team members report to both a functional leader and a business or product lead. This structure supports embedded analytics and close collaboration with business teams.
Flat Structure — Smaller organizations may use a flat structure with fewer management layers. This encourages flexibility and faster decision-making but requires strong communication and clarity of roles.
Steps on How to Create Your Data and Analytics Organizational Chart
Follow these steps to create your own data and analytics organizational structure:
Identify Key Roles and Teams — Start by listing all essential data roles, from leadership to individual contributors. Group them into core functions such as engineering, analytics, and governance.
Define Responsibilities Clearly — Document what each role owns and where decision-making authority lives. This helps reduce overlap and sets clear expectations.
Establish Reporting Relationships — Map out who reports to whom across the data organization. Clear reporting lines improve accountability and communication.
Choose the Right Structure — Select a structure that fits your organization’s size, data maturity, and operating model. The goal is to support collaboration while maintaining trust and control.
Create and Share Your Chart — Use an organizational chart tool like Organimi to build a clear, visual representation of your data and analytics team. Share it widely and keep it updated as roles evolve.
In Summary
Data and analytics teams are essential to modern business success. A clear organizational structure helps teams work efficiently, builds trust in data, and ensures insights drive real impact.
By defining roles, departments, and reporting relationships, a data and analytics organizational chart gives teams the clarity they need to grow with confidence and deliver value across the organization.
Looking to build dynamic and shareable org charts? Explore what Organimi’s org chart software can do and sign up for a free 14-day trial today!