
The human brain is more of an image processor than it is a word processor. This is according to Psychology Today, which says that much of the human brain’s sensory cortex is devoted to vision.
In fact, the part of the brain that’s responsible for processing words is quite small in comparison to the part that’s responsible for processing visual images. That’s why it’s usually easier for us to understand and remember visual information, a phenomenon known as the picture superiority effect.
It’s no wonder then why we as humans respond much better to things that are visual. Whether it’s photographs of a holiday destination or a restaurant review, we instinctively rely more on pictures and other visual elements over words.
Organizational Process Mapping
Visualization can be applied to organizations, too.
When you map out organizational processes, data flows, systems, and hierarchies, visual diagrams and designs can help your team more easily build an understanding, communicate, and unearth problems.
This is achieved using process maps. These are visual representations of things that an organization does, systems that are in place, processes that must be followed, hierarchies that exist within them, and more.
Process maps are flexible and can be used in all types of areas including product development, project planning, and customer and employee boarding. They can be used in a variety of ways, including to show specific tasks or steps, provide instructions, or provide information such as reporting relationships within organizations. The possibilities are endless.
The idea behind process mapping is to help key stakeholders such as team members and managers learly understand things like who does what, who is responsible for what, how to do something, and when something needs to be done.
Benefits of Organizational Process Mapping
Organizational process mapping is important because it gives organizations the opportunity to improve and standardize processes while giving stakeholders the opportunity to learn more easily. Some of the other benefits include:
Effectively communicates the bigger picture: Being able to see the bigger picture gives people a better idea of how processes and systems work. Team members benefit from being able to see how things are done and who’s responsible for what in the organization. This leads to a more informed workforce and improved decision making.
Shows official best practices: Organizational process mapping gives leaders the opportunity to illustrate what the official rules and best practices are for certain processes and systems. Process mapping also makes it easier to distribute this information throughout the organization to ensure that everyone is on the same page.
Leads to improved efficiency: Organizational process mapping can help your company to become more efficient and organized. This is because process mapping helps to streamline processes and define best practices, giving everyone within official points of reference for things like project planning and decision making.
3 Visual Diagrams for Organizational Process Mapping
Organizational process mapping is usually completed using visual diagrams. While there is no shortage of options when it comes to types of diagrams, we’ve highlighted three that can be adapted to must use cases.
1. Funnel Charts
A funnel chart demonstrates a linear process that has sequential connected stages. The most common type of funnel chart is a sales funnel which demonstrates the flow of customers through a sales process.
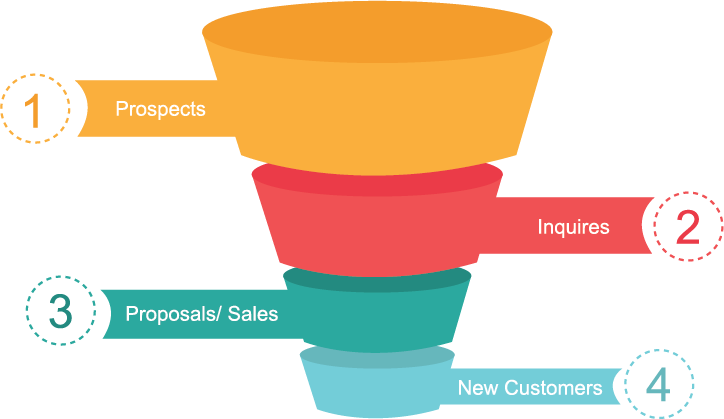
The chart takes its name from its shape, which starts from a broad beginning point and finishes at a narrow end point. Each point on the funnel chart indicates the amount of an entity at a given stage. Returning to the example of a sales funnel, the number of customers at each stage of the sales process would be indicated by the funnel’s width as it narrows.
Funnel charts are useful for high-level visuals and can be used easily in marketing, human resources, and any operation where there’s a flow of informant or content. Funnel charts can be easily adapted to different purposes.
2. Flowcharts
A flowchart is another type of diagram that represents a workflow or process. It depicts steps that must be taken in sequential order, and they are often used to document, plan, and improve complex processes in a way that’s easy to understand and read.
Flowcharts use different shapes such as rectangles, ovals, and diamonds to define the different types of steps that need to be taken while arrows and connecting flows depict the sequence.
Using flowcharts helps teams to see how processes unfold. They are great for showing processes that have multiple parts and connections. Flowcharts can also enable your team to break processes down into distinct parts or events and highlight where potential bottlenecks or constraints exist.
3. Organizational Charts (or ‘Org Charts’)
Organizational charts are diagrams that depict reporting relationships or hierarchies within an organization, with the most common application of an org chart being to show the structure of an organization. Through an org chart, you can depict how employees work and report to each other within your organization, for example.
While they are most commonly used to depict how employees work and report to each other, they can be used in a variety of different ways. They might, for example, be utilized as a management tool, for project planning, for resource planning, as a personnel directory, or as part of an employee onboarding process.

An example of an org chart built using Organimi.
Working from a template, imported data, or from scratch, you can use an org chart tool like Organimi to quickly create a hierarchy org chart that depicts the roles, responsibilities, and reporting relationships within your own organization. You can also use Organimi for a variety of other use cases including project planning and workforce management.
Start building your own org chart right now with a free trial!